pnorm(1)[1] 0.8413447Note: You may temporarily ignore this part and come back to read after the lecture 3.
As a programming language originally designed for statisticians, functions related to probability distribution are essential. For example, how to generate random numbers from a distribution, how to calculate the probability of a random event, how to find the corresponding quantile values based on a given probability, and how to calculate the density function value of a given distribution are all well implemented in R. Below, we will introduce 4 functions using the normal (Gaussian) distribution as an example.
Generating random numbers is essential for simulations, statistical modeling, and resampling techniques like bootstrapping, where random data or sampling is needed to test models, explore scenarios, or understand variability.
In R, the rnorm function is applied to generate random numbers from a normal (Gaussian) distribution. The syntax is
# Syntax of fucntion 'rnorm'
rnorm(SampleSize, mean = 0, sd = 1)
For example,
x = rnorm(100)
hist(x) Remark: We can’t simulate real random numbers on computer, but only generate pseudo-random numbers through algorithms designed to produce sequences that mimic the properties of randomness. These algorithms start with an initial value known as the random seed, which serves as the starting point for generating the sequence. By changing the seed, we can create different sequences of pseudo-random numbers, allowing for reproducibility in simulations and analyses. While these numbers may appear random, they are ultimately determined by the algorithm and the initial seed value. In R, the random seed can be controled by function ‘set.seed’, for example
# Next, if you get the same value for 'a' and 'b', I will pay you 1000kr
(a = rnorm(1))
(b = rnorm(1))

# Next, if you get different values for 'a' and 'b', I will pay you 1000kr
set.seed(2024)
(a = rnorm(1))
set.seed(2024)
(b = rnorm(1))
Life is seems like a tapestry woven with random numbers, however, to some extent it is not really random, but pseudo-random. On the one hand, it is a box of chocolates - every moment is a surprise, sweet or bitter, unfolding in unpredictable ways. You never know what the next piece will bring. However, on the other hand, we seem to be unable to escape the arrangement of fate. When you were born, God, like a careful gardener, had selected a unique seed for you. This seed contains the potential of your existence and shapes your journey. No matter what your current situation is, we should always cherish our unique seed.
The density value is useful not only in probability but also statistics, because it presents an important quantity, likelihood value. It will be discussed in the next lecture in details.
In R, the dnorm function calculates the density (or height) of the normal distribution at a specific value. The syntax is
# Syntax of function 'dnorm'
dnorm(x, mean = 0, sd = 1)
For example
# The outputs of the following two lines should be equal. Why?
dnorm(0)
1/sqrt(2*pi)In R, the pnorm function calculates the probability of an event of a normal distribution. The syntax is
# Syntax of function 'pnorm'
pnorm(a, mean = 0, sd = 1)
This function calculate the probability \(\Pr(X<a)\) which is the area under the normal density curve within the interval \([-\infty, a]\), for example,
pnorm(1)[1] 0.8413447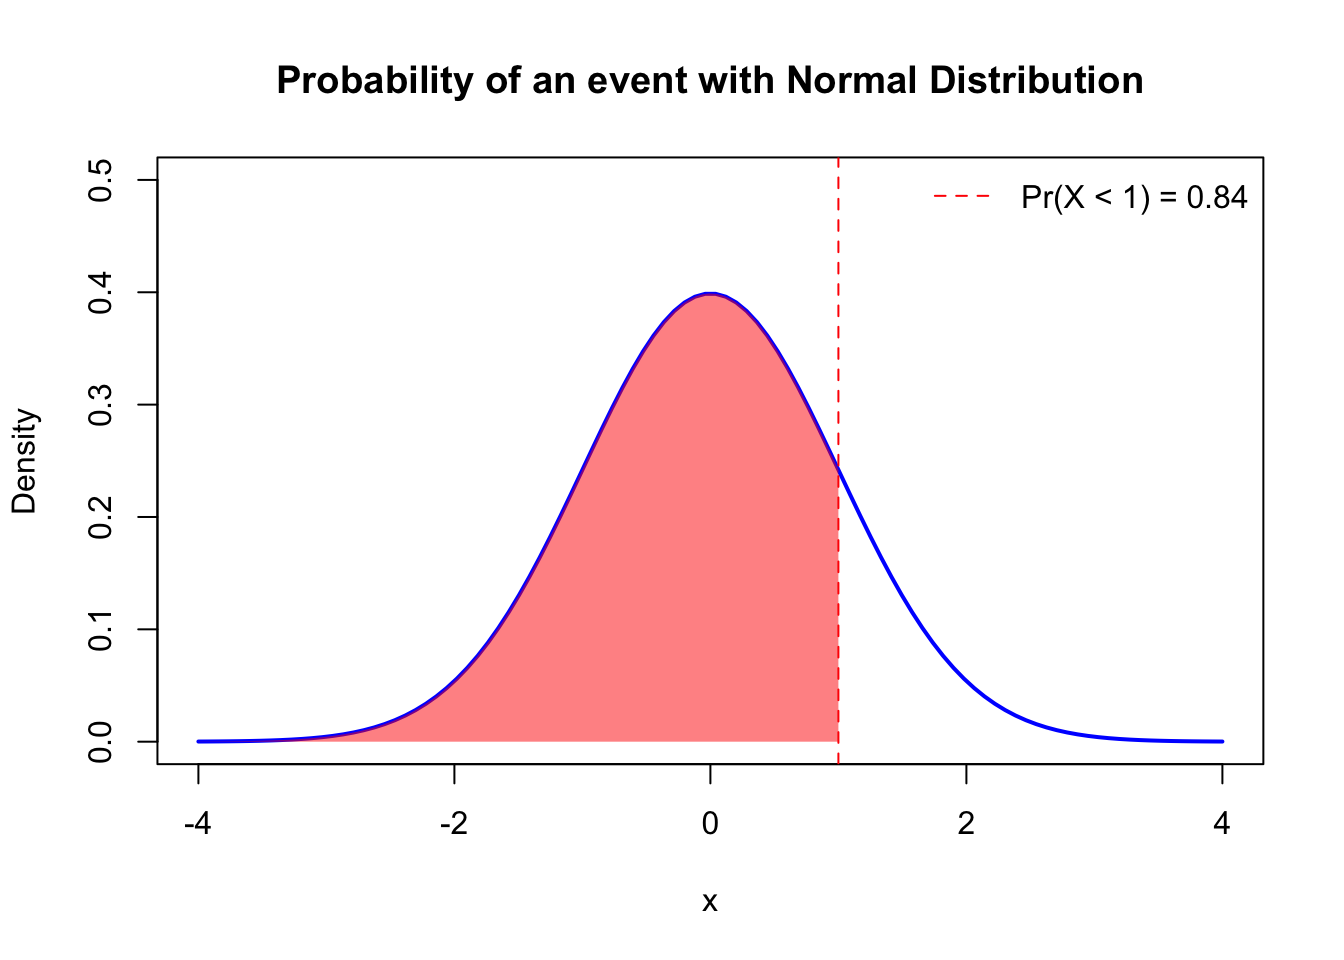
Quantile value is very essential in statistics, for example, you all need quantile value whether you are conducting hypothesis testing or calculating confidence intervals. Actually, it is just an inverse operation of calculating probability, e.g. the quantile value of \(0.84\) for a standard normal distribution is approximately \(1\) The syntax is similar, for example, you should be familiar with the following quantile value
qnorm(0.975, 0, 1) # what is it?# Functions related to normal distribution.
rnorm() # generate random numbers from normal distribution
dnorm() # find the density value of normal distribution
pnorm() # calculate the probability of an event associated to normal distribution
qnorm() # determine the quantile value of normal distributionRemark: As you can see, there is a pattern in the function names, i.e. a letter + norm, for example in ‘rnorm’,
This naming convention is applied to other distributions as well. For example:
rbinom: generates random numbers from a binomial distributiondexp: finds density value of an exponential distributionppois: calculates probability of a Poisson distributionqunif: determines the quantile value of a uniform distribution